B04
Probabilistic land use
Prof. Dr. Thomas Heckelei
University of Bonn | +49 228 73-2331 |
Dr. Hugo Storm
University of Bonn | +49 228 73-60828 / +49 157 75745561 |
Josef Baumert (PhD student)
University of Bonn | +49 228 73-60828 / +49 228 73-60833 |
Elif Donmez (PhD student)
University of Bonn | +49 228 73-60828 / +49 228 73-2326 |
Summary
Agricultural land use practices, such as crop choice and irrigation decisions, influence the temporal and spatial distribution of water and energy fluxes. In B04 we generate crop and irrigation maps that cover Europe at a 1x1 km resolution from 1990 - 2020 and that help model those fluxes. Importantly, the generated maps are consistent with existing knowledge, for example on regional crop production quantities. We apply Bayesian statistical approaches and Machine Learning to incorporate various types of information sources, such as soil and climate maps, survey data, economic statistics, and remote sensing data. The maps are probabilistic in nature, meaning that they transparently reflect data and model uncertainty.
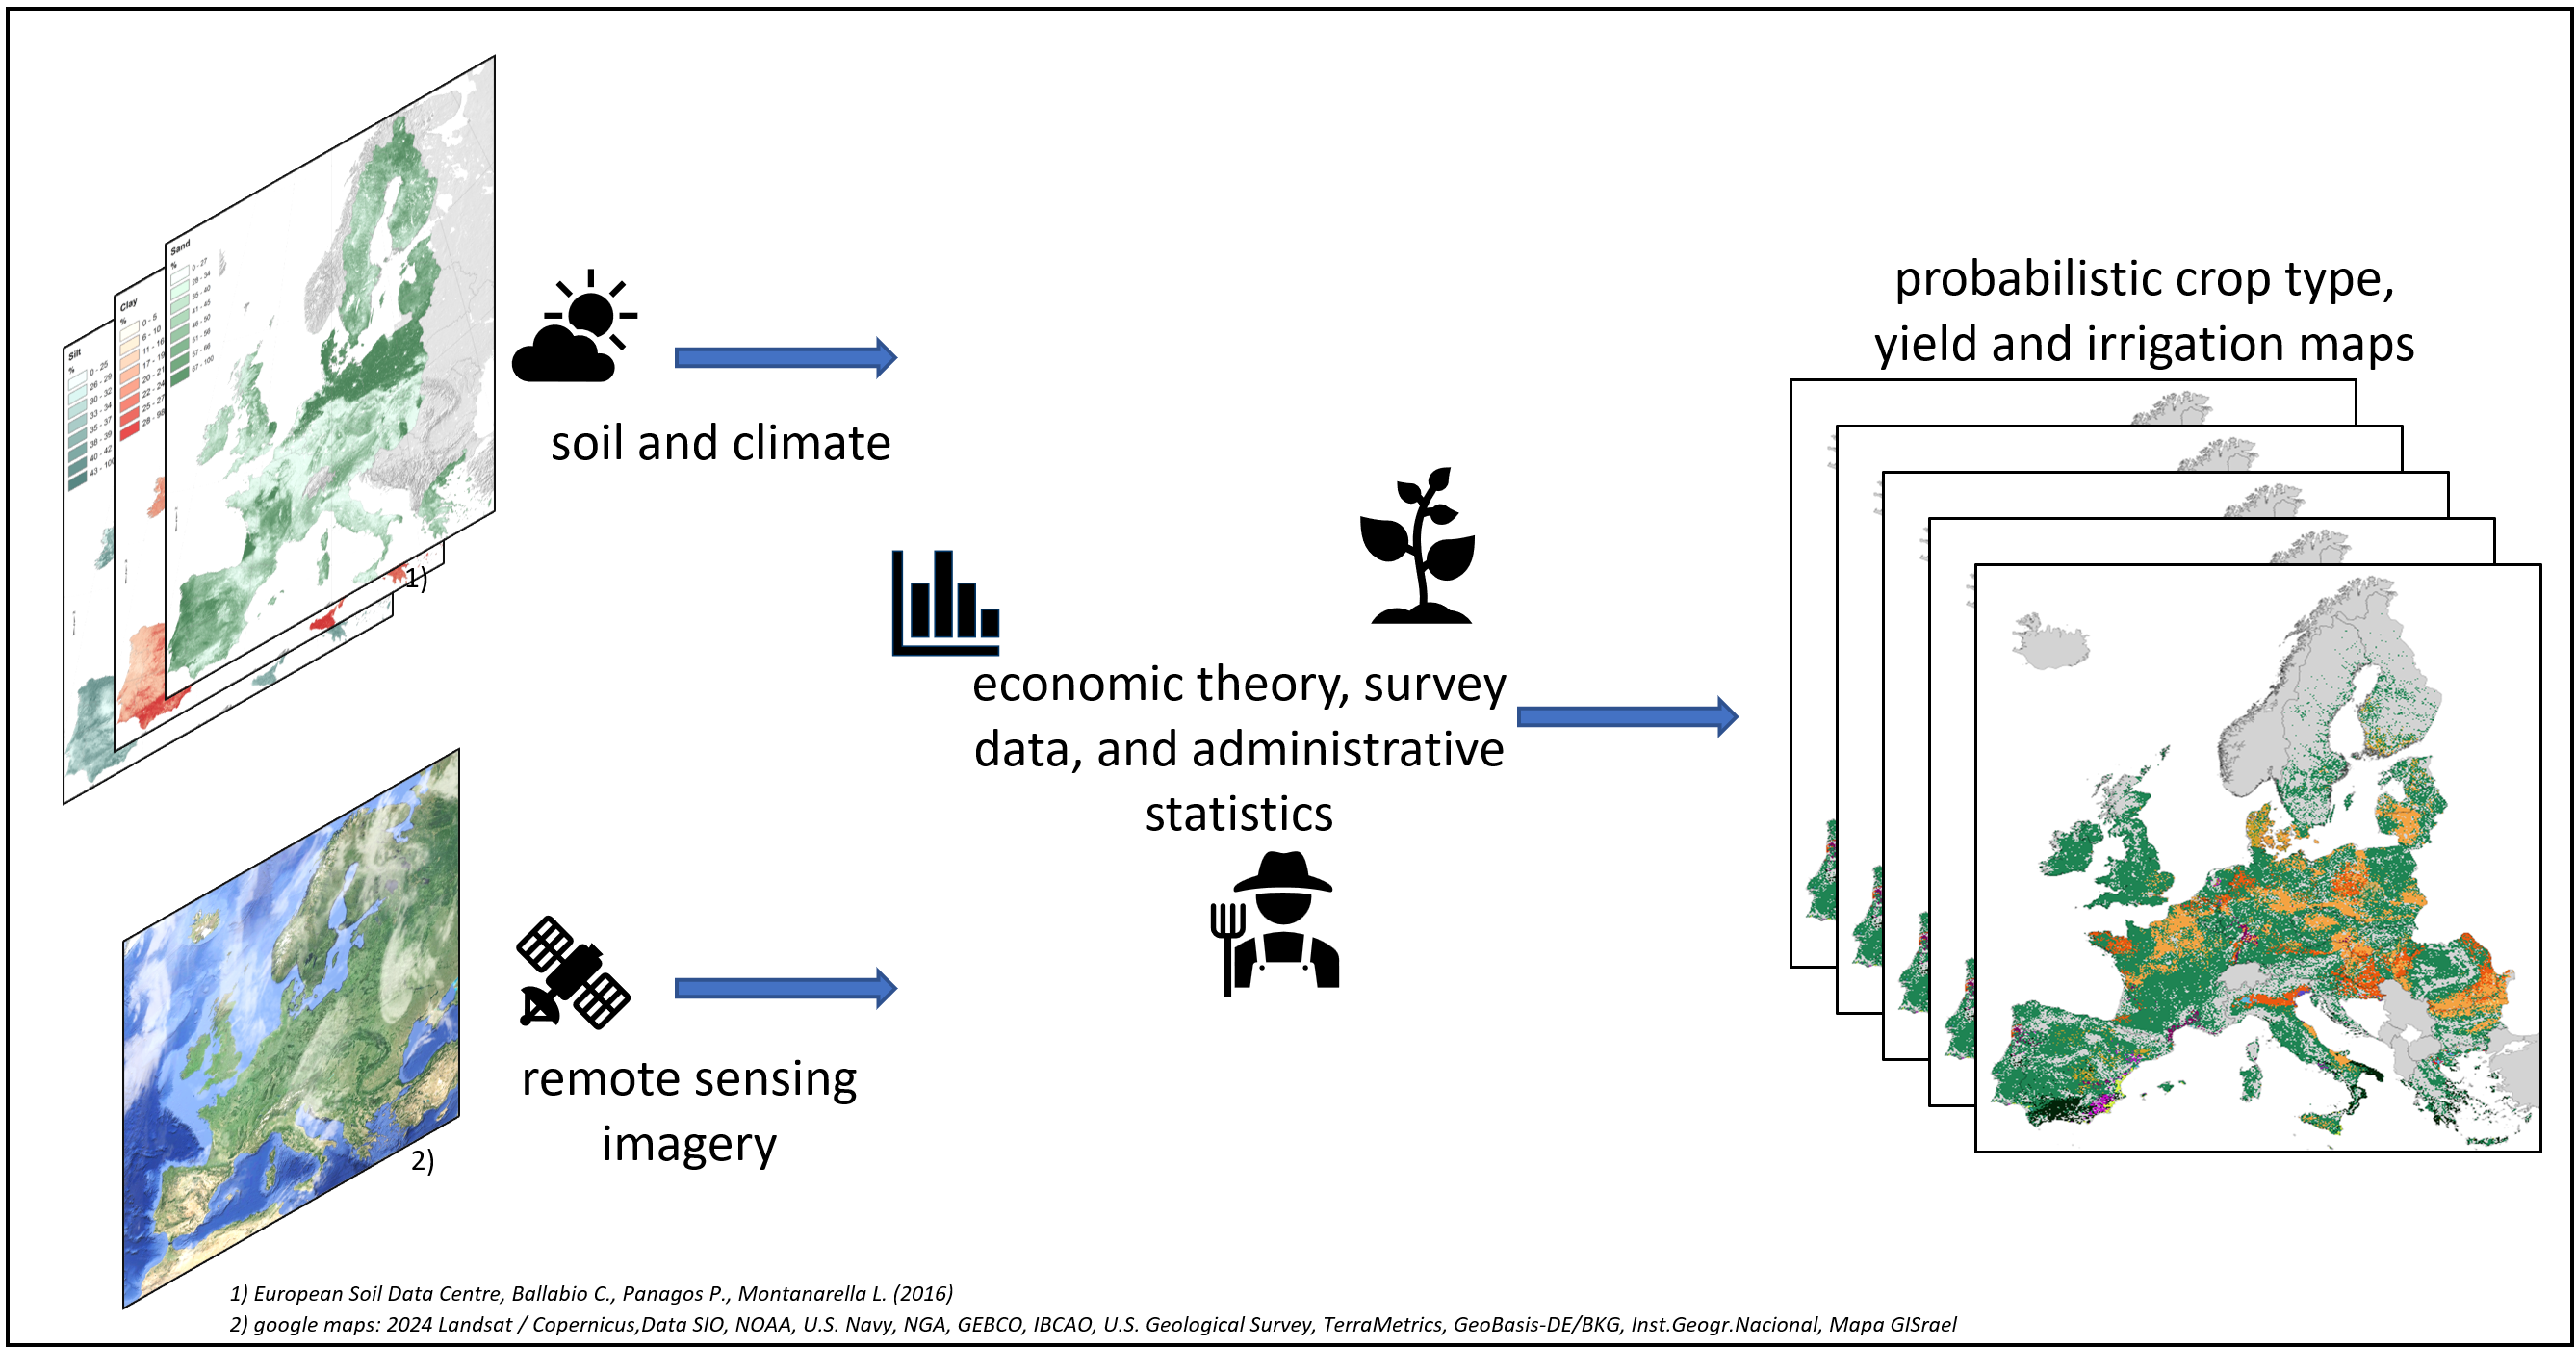
Graphical Summary
Contribution to the CRC
The probabilistic maps generated by B04 provide ex-post crop type information for Europe at an unprecedented temporal and spatial resolution. This information is used by B05 for the generation of irrigation maps over Europe, in collaboration with B04. The methodology developed by B04 additionally supports spatial disaggregation of simulation results for agricultural production from economic models in D01, it also allows to generate spatially explicit crop maps for the future. Other projects within the CRC use the maps as inputs to model water and energy fluxes. By transparently communicating the inherent uncertainty, B04 makes it possible to use those maps in an adequate and responsible manner.
Approach
In B04, we are following two approaches to generate the probabilistic land use maps: On the one hand, we are using existing soil and climate maps, together with survey-based crop observations, to understand the relationship between the local environmental and economic conditions and cropping decisions. On the other hand, we extract abundant crop cover information from satellite imagery. In further steps, we intend to combine those approaches using Bayesian probabilistic modeling. The maps are intended to reflect all relevant existing knowledge on the spatial distribution of crop cover and irrigation, meaning, for example, that consistency between the generated maps and regional statistics is guaranteed.
Main results in 2022
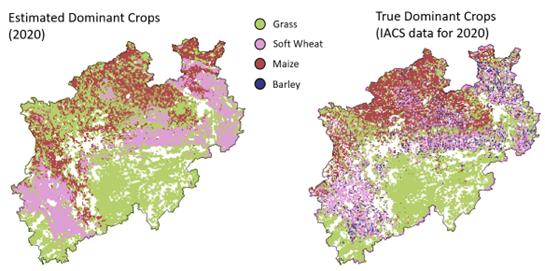
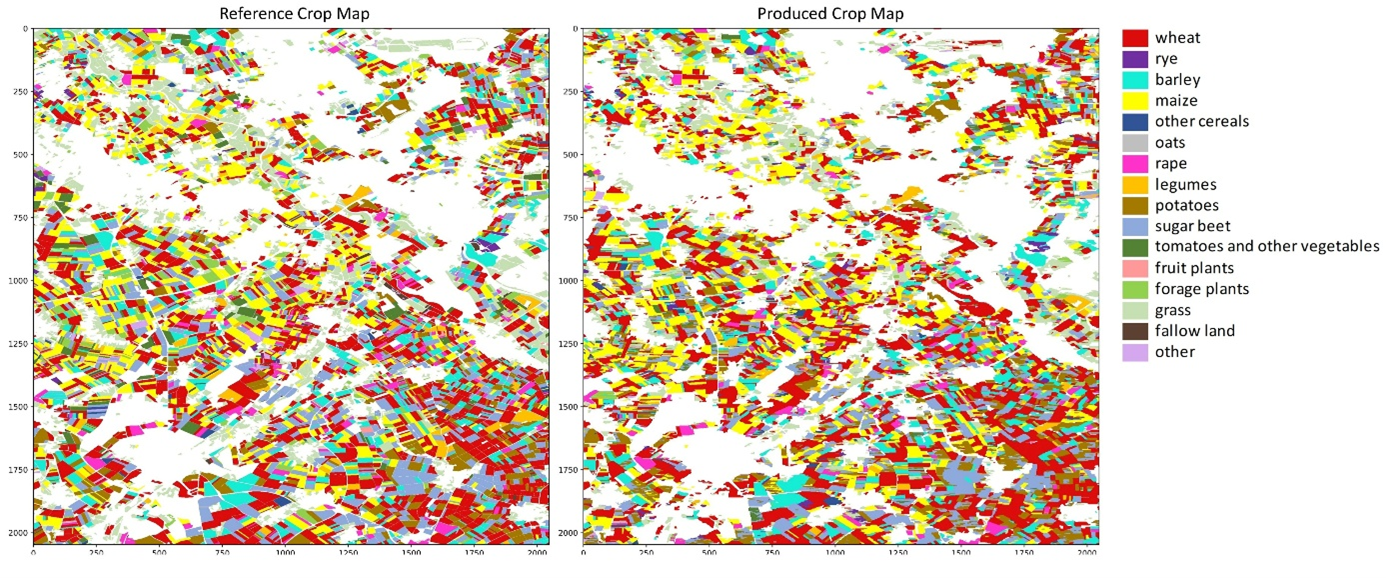
To test our developed methodology, we generated a crop map with a 1x1 km resolution for North-Rhine Westphalia (Germany). Only nine different explanatory variables related to natural agronomic conditions were used to provide crop production information that usually is available only at the province level (i.e., NUTS 1). We used IACS data that is publicly available only for selected years to validate our estimation. For visualization, the maps display for each 1x1 km cell only the dominant crop, that is the crop with the largest share in 2020.
Main results in 2023
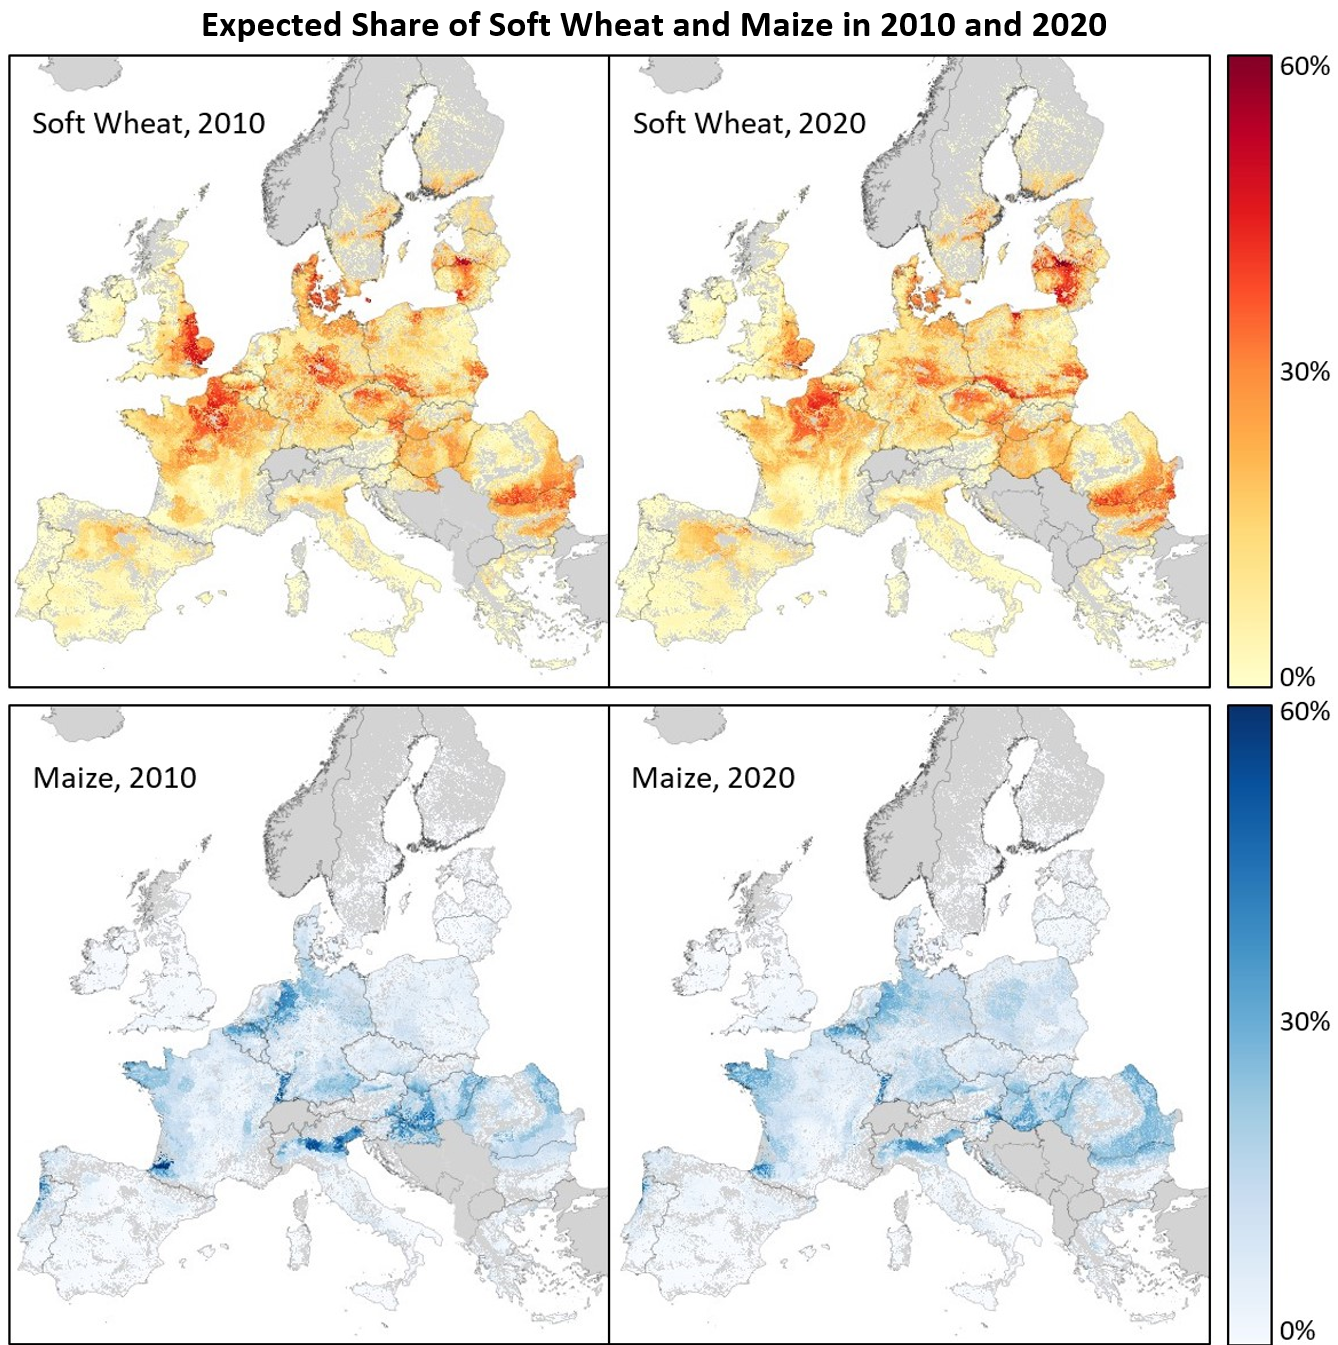
We developed and implemented a crop type mapping approach for the entire EU for the years 2010-2020, distinguishing between 28 different crop types at 1km resolution. The generated data product is unprecedented in how it combines crop detail with temporal and spatial coverage and resolution. We convey estimation uncertainty via the generation of an ensemble of 100 crop type maps. Importantly, the crop type information provided by our maps is coherent with administrative statistics at regional and national scale. The study describing the approach was published in Ecological Informatics (Baumert et al, 2024).
Main results in 2024
Building on our developed probabilistic crop type mapping approach (Baumert et al., 2024), we extended the temporal coverage of our crop type map for the EU back until the year 1990 (Baumert et al., 2025a). Extending the dataset back to 1990 required working with different input datasets, which are only available until 2018. Hence, the two datasets have partially overlapping temporal coverage but together ensure that each year between 1990 and 2020 is covered at 1km resolution for at least 25 different crop types. All probabilistic crop maps are made publicly available at Zenodo (https://zenodo.org/records/13819664; https://zenodo.org/records/14409498) and the DETECT data portal (https://detect-z03.geoinformation.net/geonetwork/srv/ger/catalog.search#/metadata/f01cf2f0-dc7f-423f-8256-a7e69d087e3b).
We additionally contributed to the generation of an EU-wide, multiannual irrigation map led by subproject B05 (Zhu et al., 2025). This dataset uses our multi-annual crop type map as an input to disaggregate administrative irrigation statistics to a grid of 1km resolution.
Main results in 2025
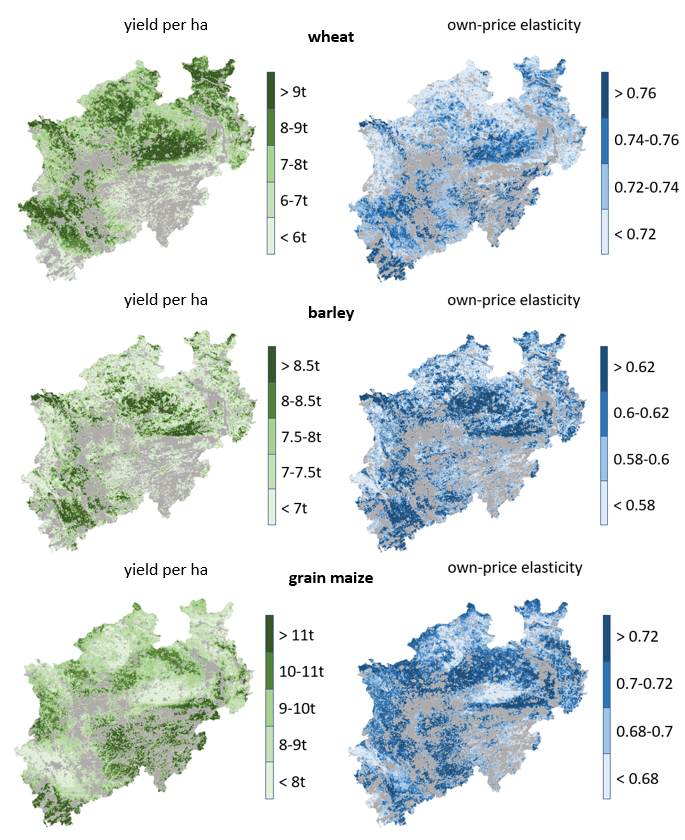
While much of our previous work focused on estimating the spatial distribution of crop types, many environmental modeling applications equally require information on management intensity and crop yields. We therefore refined our conceptual model of the data generating process to conceptually link field-level crop choice observations, environmental characteristics, and regional information on crop yields and input intensities using economic theory. The methodological novelty of the developed approach consists of i) joining different types of data, (ii) estimating latent variables of interest, (iii) deriving supply elasticities for crops at high spatial resolution, and (v) simulating counterfactuals. We apply the approach for a region in Germany and generate conceptually linked yield, crop probability, and variable input maps for 6 crops and 4 years at 100m resolution. Additionally, we are able to provide estimates for own price elasticities of supply at the resolution of 100m (Baumert et al., 2025b).
Among the alternative approaches considered for producing crop maps, we implemented an object-based method using Graph Neural Networks (GNNs) to capture spatial relationships between agricultural fields, in collaboration with subproject B03 (Donmez et al., 2025b). Using multitemporal Sentinel-1 data for North Rhine-Westphalia, Germany, image segments generated with the Felzenszwalb-Huttenlocher algorithm were represented as nodes in a graph, with spatial adjacency encoded as edges. This structure enabled the GraphSAGE architecture to exploit contextual information from neighboring segments, resulting in higher classification accuracy (88.01%) and more homogeneous maps compared to alternative neural network approaches, while also achieving faster inference times.
In addition, we conducted a systematic review of crop classification studies in Europe, comparing remote sensing sources, pre-processing techniques, and classification algorithms in terms of their reported performance (Donmez et al., 2025a). The review synthesizes developments over the last two decades, identifies methodological and data-related factors influencing classification accuracy, and highlights the evolution of approaches in response to advances in sensor technology and computational methods. By providing a structured comparison of methods and a benchmark of reported performances, the study serves as a reference for future crop mapping research and supports informed decisions on methodological and data selection for large-scale agricultural monitoring.
Publications
Baumert, J., Heckelei, T., and Storm, H. (2024). Probabilistic crop type mapping for ex-ante modelling and spatial disaggregation. Ecol. Inform. 83, 102836.
Baumert, J., Heckelei, T., and Storm, H. (2025a). A dataset of yearly probabilistic crop type maps for the EU from 1990 to 2018. Data Brief 60, 111472.
Baumert, J., Heckelei, T., and Storm, H. (2025b). Probabilistic Data Fusion for Estimating Production Function Parameters and Modeling Agricultural Supply at Field-Level. Agricultural Economics Society - AES, 99th Annual Conference, April 14-16, 2025, The University of Bordeaux, France. https://doi.org/10.22004/ag.econ.356776
Behrend, D., Nguyen, T.H., Baca Cabrera, J.C. et al. Breeding changes water use of winter wheat across Europe. npj Sustain. Agric. 4, 29 (2026). https://doi.org/10.1038/s44264-026-00135-y
Donmez, E., Leonhardt, J., Roscher, R., Heckelei, T., Storm, H. (2025b): Graph Neural Networks for Crop Cover Mapping, EGU General Assembly 2025, Vienna, Austria, 27 Apr–2 May 2025, EGU25-11619, https://doi.org/10.5194/egusphere-egu25-11619
Storm, H., Heckelei, T., and Baylis, K. (2024). Probabilistic programming for embedding theory and quantifying uncertainty in econometric analysis. Eur. Rev. Agric. Econ. 51(3):589-616.
Zhu, W., Baumert, J., Storm, H., Heckelei, T., Siebert, S. (2025): ECIRA - European crop-specific irrigated area at 1 km resolution annually from 2010 to 2020. Scientific Data 12, 1349 (2025). https://doi.org/10.1038/s41597-025-05628-y