D02
Simulating past and future responses of the terrestrial system to greenhouse gas forcing and regional anthropogenic interventions
Prof. Stefan Kollet Ph.D
Forschungszentrum Jülich | +49 2461 619593 |
Jun. Prof. Dr. techn. Michael Schindelegger
University of Bonn | +49 228 73-6345 |
Yikui Zhang (PhD student)
Forschungszentrum Jülich | +49 2461 616821 |
Francis Lopes (PhD student)
University of Bonn | +49 228 73-60595 |
Summary
In project D02, we explore whether—and to what extent—anthropogenic interventions can lead to persistent, potentially unsustainable changes in the coupled water and energy cycles of the surface/sub-surface-atmospheric system. We address these fundamental questions by performing regional forward simulations of the terrestrial system from groundwater to the top of the atmosphere under consideration of water and energy balance constraints over the European continent and the adjacent ocean. A carefully designed hierarchy of experiments, both for historical and 21st century time lines, will facilitate the identification and spatial localization of the anthropogenic impact against the background of natural variability and greenhouse gas forcing.
Graphical summary
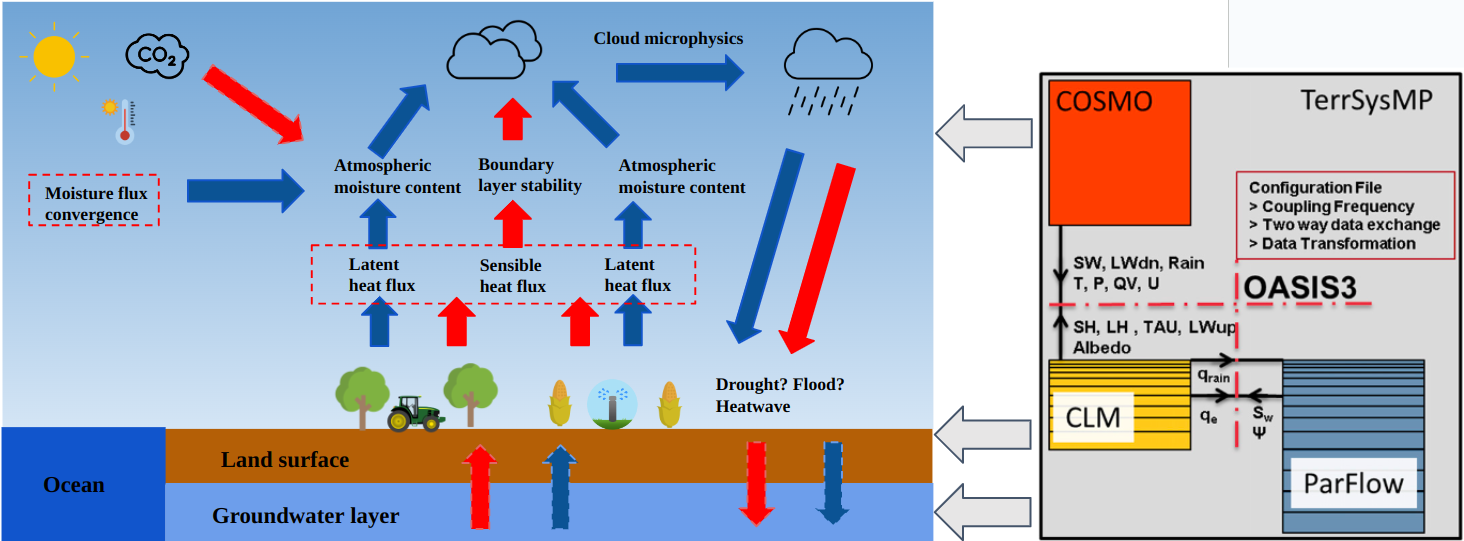
Figure 1: Graphical summary of project D02
Contribution to the CRC
- Probing the central hypothesis of the CRC: Do anthropogenic modifications alter regional feedbacks in the terrestrial system and lead to persistent changes in the coupled water and energy cycles of the surface/sub-surface-atmospheric system?
- Identifying possible unsustainable trajectories with regard to freshwater resources and agriculture on regional scales
- Constraining signals and uncertainties in the modeled water cycle associated with moisture input from the ocean
- Providing results from historical simulations and projections to the attribution and budget analyses of other projects in the CRC
Approach
- Terrestrial System: Use of the Terrestrial System Modelling Platform, TSMP, which closes budgets across model components: Sub-surface, land surface, and atmosphere, as represented by ParFlow, CLM (Community Land Model, in different versions), and ICON or COSMO, respectively
- TSMP simulations over EURO-CORDEX slightly extended to the east, starting from control runs and then considering relevant perturbations: Greenhouse gas forcing, land use change, human water use such as groundwater abstraction and irrigation
- Simulations resolve pertinent variabilities and non-linearities in states, fluxes, and feedbacks, on time scales relevant to events and trends
- Analysis of the simulations focuses on how land-atmosphere conditions and feedbacks vary with each individual system perturbation; both linear and non-linear analyses methods are being pursued for feedback identification
- Ocean: Stand-alone (i.e., uncoupled) ICON simulations and water budget analyses to assess how biases and uncertainties in sea surface temperature (SST) impact the modeled regional atmospheric water cycle
- Using these simulations, we explore approaches (e.g., calibration of SST fields) to avoid excess oceanic evaporation and resulting excess precipitation over land
Main Results in 2022 and 2023 – Terrestrial system
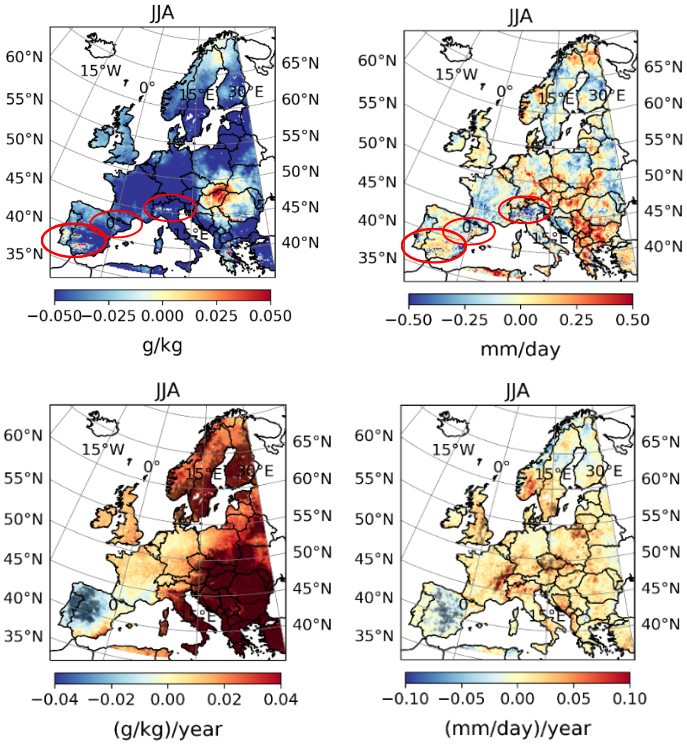
Figure 2. First row: Time-mean differences between HWU and CTRL runs in terms of 2-m specific humidity (left) and surface water availability (P–ET, right); Second row: Trend differences between HWU and CTL runs for the same two quantities. Red circles point out the intensively irrigated regions.
We performed a set of historical and projection simulations with TSMP at 12-km spacing, as well as a reference climatology run (1979–2021) driven by ERA5 reanalysis, one time without human water use effects (CTL run), and then with irrigation and groundwater abstraction (HWU run). We use the reference climatology run to identify the direct impact of human water use on the water cycle. Differences between HWU and CTL (Figure 2, first row) suggest a significant increase in 2-meter surface specific humidity and a decrease in water availability (precipitation P minus evaporation ET) due to enhanced ET in some irrigation hotspots, but no remote effects can be detected. In the second row in Figure 2, there are no clear changes in the trend between HWU and CTL runs in intensively-irrigated regions, indicating that the long-term trends in surface water content and water availability are mostly attributable to greenhouse gas forcing at large scale rather than the regional intervention.
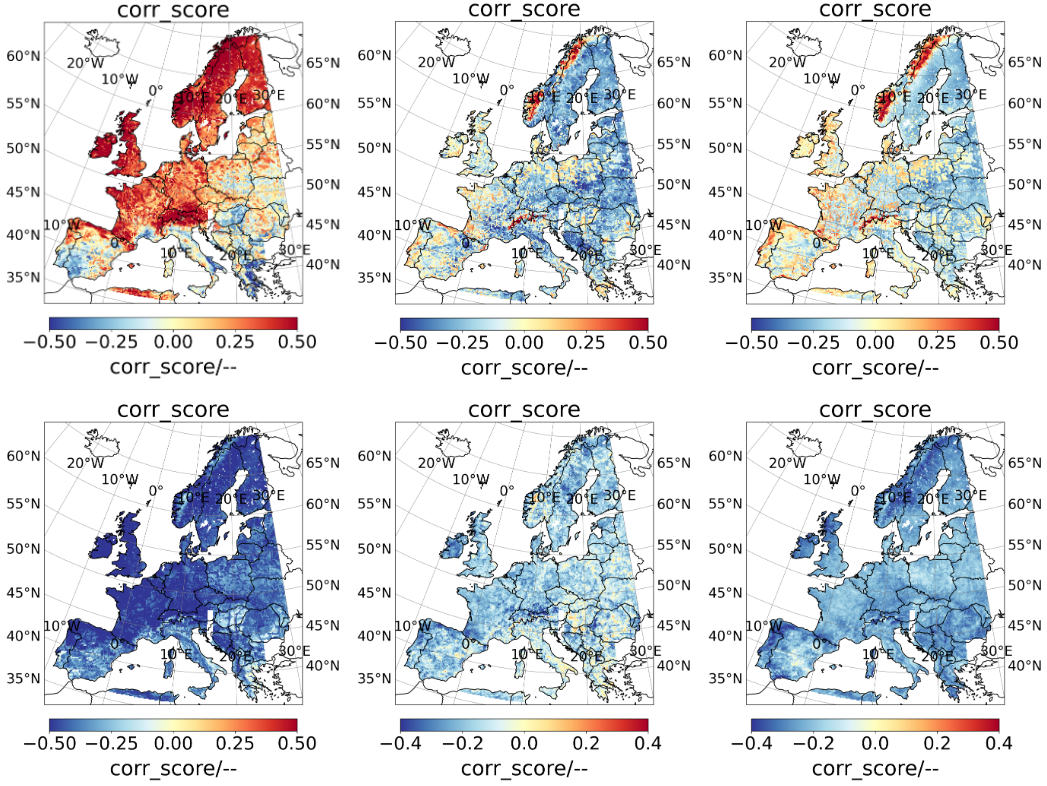
Figure 3. Pearson correlation in the reference climatology run between (first row) latent and sensible heat flux, and (second row) ET and cloud water content. Columns from left to right indicate correlations from the full dataset, for cloudy days, and for rainy days.
We also analyzed the reference climatology run (1979–2021) to diagnose the land-atmosphere coupling strength over the EURO-CORDEX domain under different weather and moisture dynamic regimes. Emphasis is on feedbacks between surface flux, boundary layer processes, and cloud formation. We divide the dataset into three scenarios to test the impact of weather conditions: Full dataset (i.e., no temporal subsetting), cloudy days without precipitation, and rainy days. Figure 3 (first row) shows that the coupling between latent heat and sensible heat flux, representing the energy partition at the land surface, exhibits a north-south (positive-to-negative) dipole pattern in the full dataset. By contrast, the coupling tends to be more negative across the domain on cloudy days and very weak on rainy days. Maps of correlation between ET and cloud water content (Figure 3, second row) reveal a negative coupling between these two variables over the entire domain. The negative coupling is consistent with the strong control exerted by the atmosphere on the surface flux, but appears much less pronounced on cloudy days.
Main Results in 2024 – Terrestrial system
In first part of work, we analyzed L-A moisture flux feedbacks under different atmospheric conditions in the warm season based on TSMP simulations using correlation and binned-average scaling analysis, focusing on the relationship between ET and cloud water. We found contrasting relationships as shown in Figure 4: A negative correlation between ET -cloud water indicates ET declines as the cloud moisture increases while the predominantly positive ET -cloud water scaling relationship highlights the role of surface moisture flux in influencing cloud moisture dynamics. The role of the ET regime in this feedback is also highlighted: the hotspots between ET - cloud water feedback in Europe are mostly located in transitional zones in Eastern Europe and the Mediterranean, while the distribution of their scaling is determined by energy or water-limited ET regimes. Under dry condition, the shift of logarithmic scaling towards the hook scaling relationship in regions typically under an energy-limited regime indicates that a drier atmosphere can strengthen the local coupling by increasing the surface control on the atmosphere, while under Rwet there is a stronger atmospheric control on the surface variables due to the incoming energy as a constraint. The identified shift further reflects the potential effect of L-A coupling in intensifying hydrometeorological extreme events like droughts. In summary, our results highlight the role of cloud water in the atmospheric part of the L-A interaction and reveal the impact of different atmospheric conditions on L-A interaction. The proposed scaling analysis framework also demonstrates its advantages in accounting for the varying relationship between land and atmospheric variables over the sub-daily period. The identified non-linear scaling relationship of L-A interaction shows the limitations of common indices in representing the co-varying pattern of two variables, which calls for new metrics and tools for diagnosis.
This work has been published in Zhang, Y., Wagner, N., Goergen, K. et al. Summer evapotranspiration-cloud feedbacks in land-atmosphere interactions over Europe. Clim Dyn 62, 10767–10783 (2024). https://doi.org/10.1007/s00382-024-07475-w
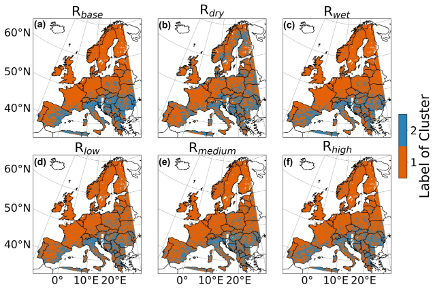
Figure 4: Spatial distribution of the two types of scaling curves between ET and changes in cloud water over all atmospheric regimes over the EURO-CORDEX region.
Second part of work in 2024 comes to the application of information flow methods on analyzing land-atmosphere coupling during compound events. Since the variability of mass and energy in the climate system can be explained as the function of information fluxes, this study applies a causal inference framework based on information flow (IF) to quantify the influences of soil water content (SM) and absorbed shortwave radiation (R) on near-surface air temperature (T) during CDHEs. To this end, simulation results from the fully coupled regional climate system model Terrestrial System Modeling Platform (TSMP) over the EUR-12 region are utilised. Our results reveal that the study domain is predominantly energy-limited, characterized by strong R to T coupling, though water-limited regimes prevail in southwest Europe, showing a stronger SM to T coupling. E.g., the 2003 European CDHE was characterized by a widespread regime shift from energy- to water-limited conditions, which reversed following the precipitation t hat ended the event. As shown in Figure 5, a significant increase in positive SM–>T is identified as a key contributor to the extreme nature of the 2003 CDHE, driven by the persistently dry antecedent conditions. These findings ratify the critical role of spatial-temporal land-atmosphere coupling in shaping CDHE trajectories from the perspective of information theory. Moreover, the IF framework is a powerful diagnostic for uncovering causal drivers of extremes, evaluating climate models, and enhancing the sub-seasonal predictability of ecosystem responses under compound climate extremes. The work is be soon submitted to Environmental Research Letters.
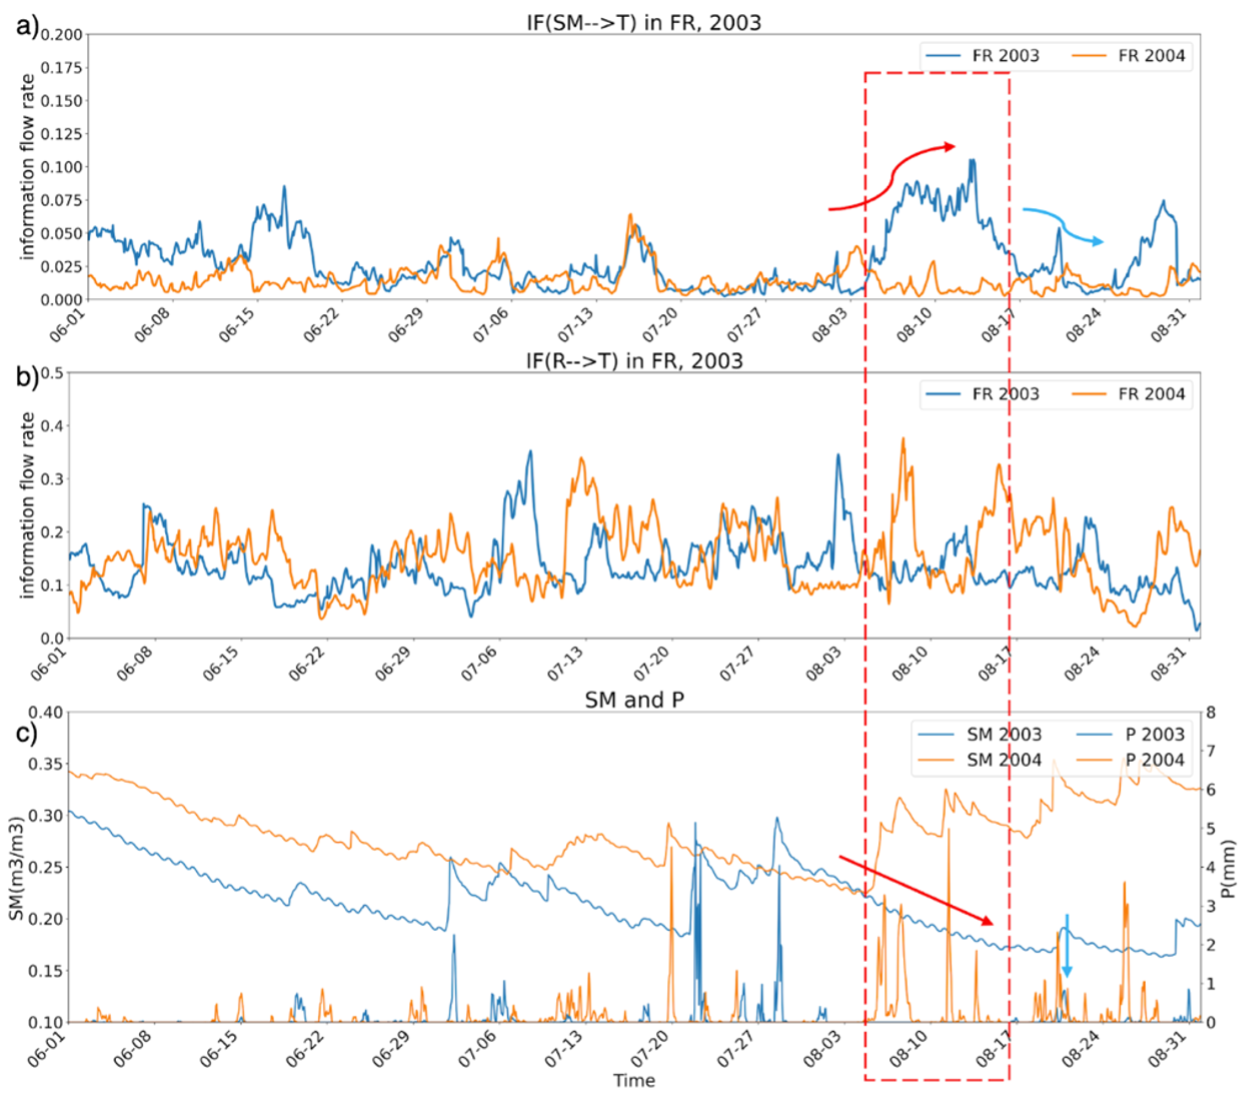
Figure 5: Domain-averaged hourly time series of information flow rate and climate variables in a 10*10 grid domain in France (FR) as in Fig. 2, in 2003 (blue) and 2004 (orange) summer. a). Hourly SM–>T; b). Hourly R–>T; c). The hourly time series of SM and precipitation (P). The red and blue arrows in Fig. 5a represent the increase and decrease trend in SM–>T, while the straight red and blue arrows in Fig. 5c represent the depletion of soil moisture and the occurrence of precipitation events. The red dashed box shows the 2003 CDHE period. The unit of IF is in nats/h.
Main Results in 2025 – Terrestrial system
Following the second part of work in 2024, we further applied the information flow method on TSMP irrigation scenarios. There is a key research gap remains in understanding how human interventions, particularly irrigation, influence the response of the climate system to extreme climate conditions. This study investigates how irrigation modulates land-atmosphere (L-A) coupling and shapes compound dry-hot event (CDHE) characteristics across Europe. Using a fully coupled Terrestrial System Modeling Platform (TSMP), we conducted three simulations (one control run and two with different irrigation datasets) from 1990 to 2014. We first identified CDHEs by a threshold-based method and then assessed the effect of irrigation on their frequency, duration, and thermal intensity. Results show that irrigation locally increases soil water content and reduces near-surface temperature, thereby mitigating both the occurrence and severity of CDHEs. The cooling effect is tied to enhanced evapotranspiration under irrigation, which shifts energy partitioning from sensible to latent heat. However, these benefits remain spatially confined to heavily irrigated areas, indicating limited large-scale influence. To diagnose the functional response of the climate system to perturbations, we applied a time-varying multivariate Liang–Kleeman information flow (IF) framework to quantify causal relationships among soil moisture, temperature, and other confounding factors. The IF analysis reveals that irrigation weakens the control of soil moisture at near-surface temperature, preventing the ecosystem from rapidly transitioning into water-limited regimes during heat extremes as shown in Figure 6. These findings underscore the potential of irrigation to locally alleviate CDHEs and highlight the IF approach as a robust tool for process-level diagnostics of climate models, offering deeper insights into how both natural extremes and human interventions shape L-A coupling. The work is to be submitted to Environmental Research Letters.
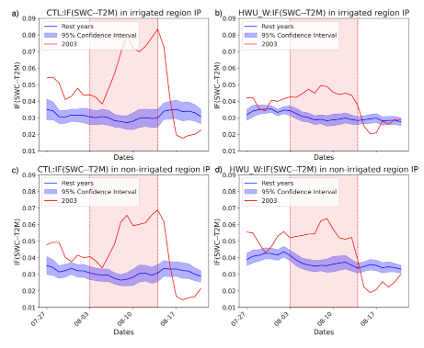
Figure 6: Stacked time series of domains averaged information flow rate in irrigated and non-irrigated grid points over multiple years during the same time period as in 2003 Compound dry-hot (CDHE) period. First row shows the time series in irrigated grid points and the second row shows the non-irrigated grid points in CTL and HWU runs, respectively. The red line represents the time series in 2003 and the blue line represents the averaged time series over the entire simulation period without 2003. The blue shade area represents the 95% confidence interval.
To enable more downstream applications of TSMP simulations, a deep learning model, Focal-TSMP, has been developed by Shams and Gall 2024 to predict NDVI and agricultural drought given the TSMP simulations. It achieved outstanding performance on using TSMP baseline simulation to forecast agricultural drought. However, TSMP can have multiple scenarios (e.g. irrigation or land use changes) for sensitivity analysis, training deep learning models to forecast drought for individual scenarios can be computationally and operationally expensive. Also, independent models make it harder to compare scenarios consistently and diagnose the physical consistency. So how can we generalize one model to different TSMP scenarios? We developed a generalized deep learning model to predict drought under various TSMP scenarios by encoding multi-modal scenario information through different strategies, including Vision-Large Language Model. Initial results have shown that the proposed method can explicitly forecast the NDVI loss due to the land use change with lower LAI as in Figure 7, improving the generalization ability of the drought forecast and enabling its zero-shot application on more TSMP scenarios. More developments are still going on and the evaluation is being extended to other TSMP sensitivity scenarios and physical variables to further validate the robustness of the generalized model.
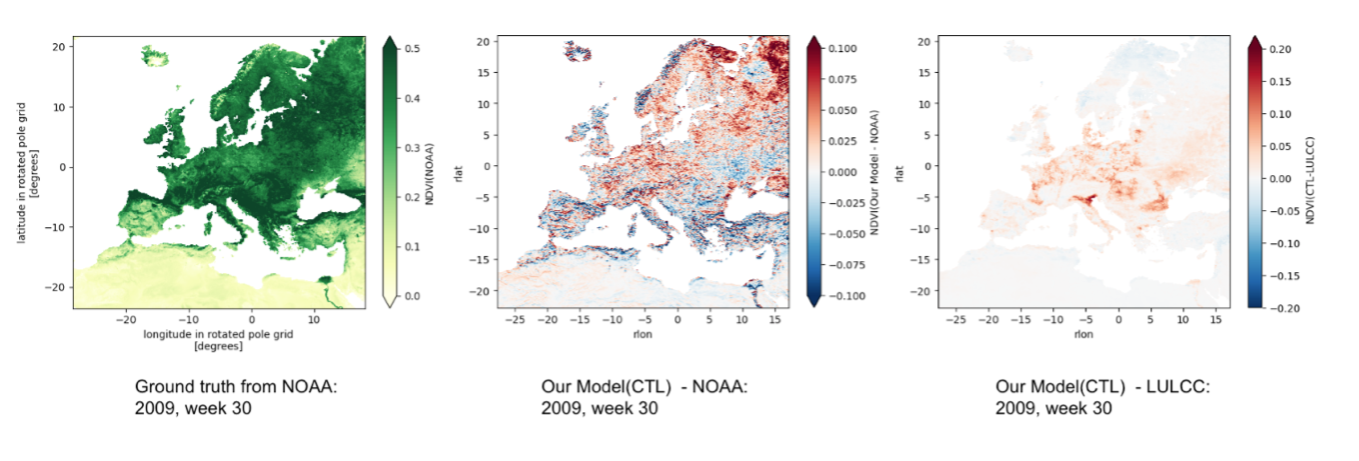
Figure 7: (a) Groundtruth NDVI from NOAA remote sensing dataset on week 30, 2009; (b) NDVI bias between forecast from TSMP baseline and Groundtruth; (c). NDVI bias between forecast from TSMP baseline and land cover/landuse change scenario.
Besides the scientific work, four types of TSMP simulations over EU-CORDEX region at 12km resolution using the ERA5 reanalysis dataset as boundary conditions have been completed: baseline (CTL), human water use with irrigation data from Wada et al. (2016) (HWU-W), human water use with irrigation data from DETECT B05 (Siebert et al., 2010) (HWU-S), and land-use/land-cover change (LULCCv1) with dynamic crop cover data from DETECT B04 (Storm et al., 2024). An additional LULCCv2 experiment is currently in progress.
Main Results in 2022 and 2023 – Role of the ocean
In the first 1.5 years of the project, the groundwork was laid for a modeling study on how water budget quantities in a EURO-CORDEX setup of ICON change with different, equally permissible SST datasets prescribed over the ocean. From a technical point of view, one important step was to establish a workflow engine to run chain jobs of ICON stand-alone (12-km spacing) from within a proper runtime environment (SPICE). Apart from first sensitivity experiments, we assembled daily-sampled, multi-decadal SST fields from various sources (e.g., atmospheric reanalyses, remote sensing products) and analyzed their different spatiotemporal characteristics on a common 0.25° x 0.25° grid. The three SST datasets eventually chosen for our ICON simulations are (1) ERA5 skin temperatures, abbreviated here as ERA5SKT, (2) ERA5 SST, abbreviated as ERA5SST, and (3) the 1-km MURSST product. Both ERA5SST and MURSST provide values of SST foundation, i.e., a bulk temperature at reference depths of 4–10 m. This quantity is slightly warmer than the associated skin temperature, by about 0.2°C on average, see Figure 4. In an RCM, such warm offset can be expected to increase oceanic evaporation and the amount of moisture available for advection onto land.
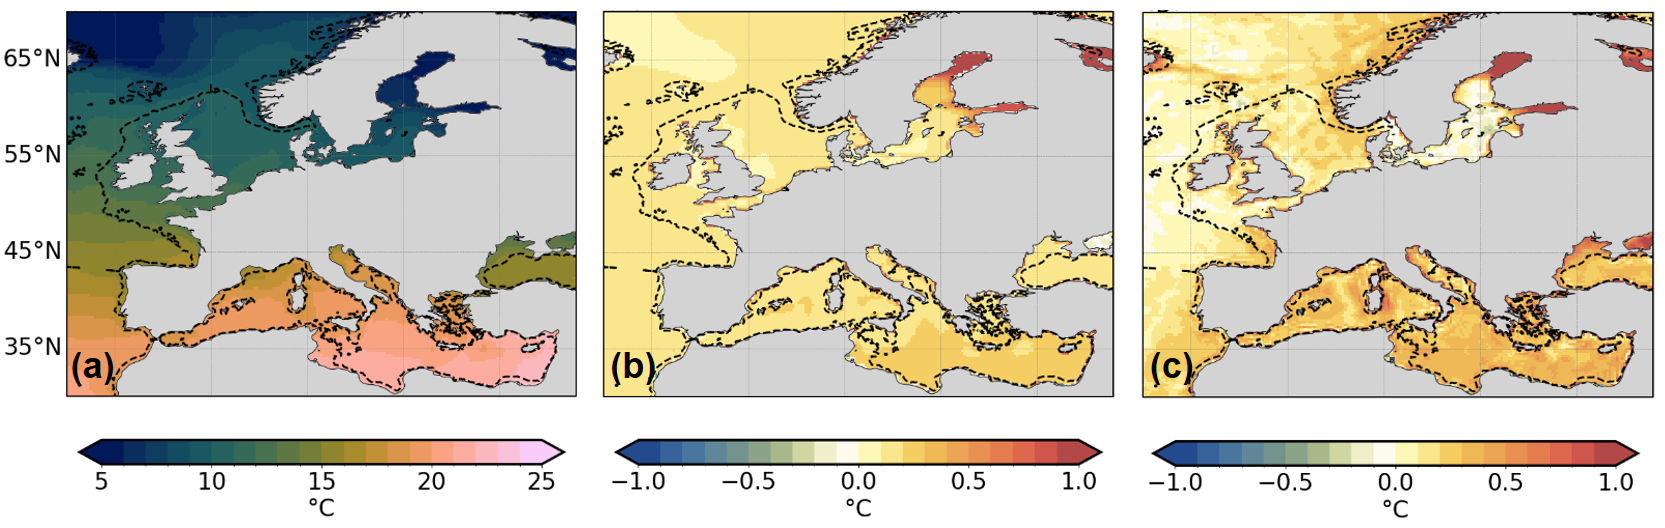
Figure 8: Comparison of the employed SST datasets in terms of their mean state for the period June 2002 to May 2011. Shown are (a) the ERA5SKT annual mean climatology in °C and (b, c) differences of the slightly warmer ERA5SST and MURSST datasets to (a).
Main Results in 2024 – Role of the ocean
We continued our forward simulations with ICON in limited-area mode with ERA5 boundary forcing and eventually took all three experiments (for the three SST datasets) out to 9 years, from June 2002 to May 2011. The precipitation fields from these simulations were found to compare more favorably to gridded observations than ERA5, especially over mountain massifs. Regarding sensitivities, use of one SST product over another in ICON does indeed lead to differences in the simulated water budget quantities (Figure 5). The differences are more pronounced at small spatial scales, where they partly manifest model internal variability. When looking at domain averages, the mean annual precipitation over land is slightly increased (+2.5%) in the ERA5SST and MURSST experiments relative to ERA5SKT, consistent with the warmer mean state of foundation temperatures (Figure 4). With the help of sub-project D07, we further combined the simulated P–E series from ICON with observed discharge and terrestrial water storages changes to test for potential sensitivities to the driving SST in the terrestrial water budgets at catchment scales. Except for some Eastern European river basins, the budget statistics for the three experiments were found to be very similar (see da Silva Lopes et al. 2025).
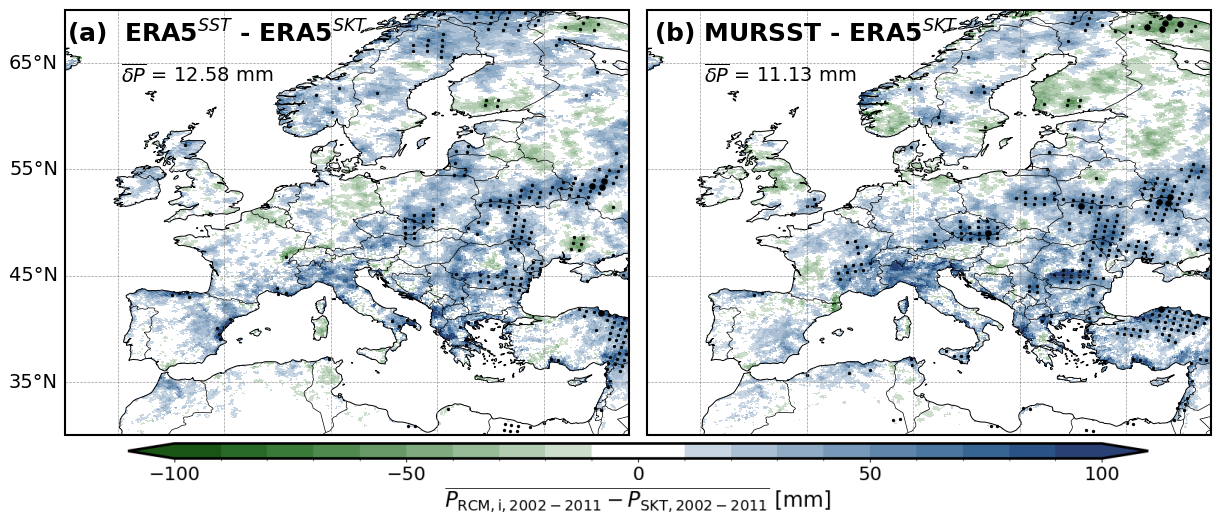
Figure 9: Differences between the (a) ERA5SST and ERA5SKT simulations, and (b) the MURSST and ERA5SKT simulations in terms of the mean annual precipitation sum (mm, average over 2002–2011). Grid points with statistically significant differences at 68% (respectively 95%) confidence are marked with light (heavy) dots. Values in the top left corner are the spatial averages of the displayed differences. For reference, the ERA5SKT mean annual precipitation averages 522 mm over EURO-CORDEX.
Lopes, F. d. S., M. Schindelegger, B. Gutknecht, and J. Kusche, 2026: Dynamically Downscaled European Water Budget Quantities in the Presence of Sea Surface Temperature Uncertainty. J. Hydrometeor., 27, 129–149, https://doi.org/10.1175/JHM-D-25-0018.1.
Main Results in 2025 – Role of the ocean
Additional perturbation experiments with the previously used ICON setup were conducted. In detail, we re-ran the 9-year ERA5SST experiments two times, imposing spatially uniform offsets of –1.0°C (cold case) and +1.0°C (warm case) on the time-varying SST fields. The +1.0°C shift in the warm case roughly represents the accumulated surface warming of the Mediterranean Sea over the past 15 years. These somewhat more drastic—yet not unrealistic—changes in SST clearly modulate all water budget quantities in the model. One pertinent example is given in Figure 6, which suggests a considerable increase in the number of days with intense precipitation in the +1.0°C simulation across most of Europe.
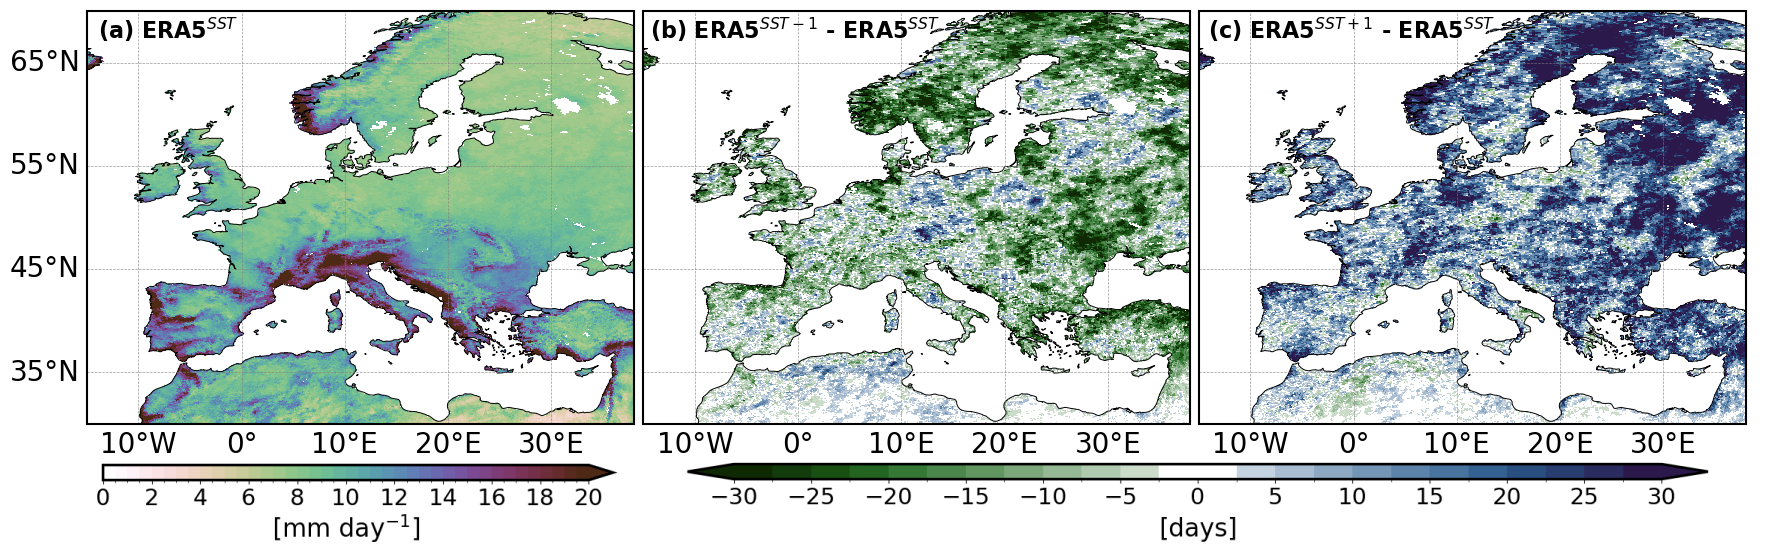
Figure 10: Daily precipitation statistics in 12-km stand-alone ICON simulations over 2002–2011. Shown are (a) the 90th percentile of daily precipitation (mm) in the ERA5SST experiment, along with (b, c) changes in the number of days where local precipitation exceeds the threshold as given by (a). These changes are plotted for two separate simulations: ERA5SST–1.0°C (cold case) and ERA5SST+1.0°C (warm case). Only wet days with accumulated P ≥ 1 mm were considered for the analysis.